VOLUME 9: Table of Contents
TEACHING ISSUES AND EXPERIMENTS IN ECOLOGY
TEACHING
ALL VOLUMES
SUBMIT WORK
SEARCH

EXPERIMENTS
Teaching Exponential and Logistic Growth in a Variety of Classroom and Laboratory Settings
ABSTRACTEcology and conservation biology contain numerous examples of populations growing without bounds or shrinking towards extinction. For these populations, the change in the number of individuals generally follows an exponential curve. On the other hand, limited resources may keep population numbers in check and help maintain the population at the environment's carrying capacity. These density-dependent constraints on population growth can be described by the logistic growth equation. The logistic growth equation provides a clear extension of the density-independent process described by exponential growth. In general, exponential growth and decline along with logistic growth can be conceptually challenging for students when presented in a traditional lecture setting. Establishing a solid understanding of exponential and logistic growth, core concepts in population and community ecology, provides a foundation on which students can build on in future studies. The module described here, employed in either a laboratory or classroom setting is designed to actively engage students in building their understanding of exponential and logistic processes. The module includes components that address a variety of learning styles (visual and tactile, for example). The module consists of pre-module assessments of students’ prior knowledge, three short “chalk talks” on exponential and logistic growth, the activities, and post-module assessments. The time required for the activity will vary depending on replication and depth of coverage, but will require at least 80 minutes. We recommend carrying out these exercises in either one laboratory period or two lectures. The activity is designed for students to work in groups. Each group is given a set of containers representing samples from a hypothetical population. Each container, representing different sampling times, contains a different, predetermined number of units (individuals from the population, represented by pieces of candy or beads). To explore exponential growth, the students count the individuals at each time point and use arithmetic and semi-log graph paper to plot the data. From the data and graph(s), the students determine whether their population is growing, declining, or being maintained at a stable size. The students can then be called upon to predict future population sizes. Exploration of the logistic equation follows similar methodology except population numbers plateau over time. The module, as a whole, is quite flexible and can be easily adapted to a variety of institutions, subjects, or course levels, depending upon the need of the class. It can also be applied to other fields, such as geology (e.g., decay of radioactive isotopes).
AUTHORSBarry Aronhime1*, Bret D. Elderd1, Carol Wicks2, Margaret McMichael3, Elizabeth Eich4 1 - Department of Biological Sciences, Louisiana State University, Baton Rouge, LA 70803 2 - Department of Geology & Geophysics, Louisiana State University, Baton Rouge, LA 70803 3 - Baton Rouge Community College, Baton Rouge, LA 70806 4 - Biochemistry and Cell Biology Department, Rice University, Houston, TX 77251 *Corresponding Author: baronh1@lsu.edu CLASS TIMEThe amount of in-class time depends upon the instructor's needs and goals. The core activity, during which students collect and graph the exponential data on arithmetic graph paper, can be completed within 50 minutes. Class or lab periods of 80 minutes provide sufficient time for students to create a second graph, on semi-log paper. The module can be expanded further, for a three hour ecology laboratory, for example, by including a section on regression where students estimate population growth rates directly from the data. The logistic growth portion will likely require an additional 20-30 minutes of class time. OUTSIDE OF CLASS TIMEEach student will need 30-60 minutes for reading assigned materials (chapters in text, laboratory manual) before class. For a full laboratory, the students can complete a homework assignment based on the data collected that day. STUDENT PRODUCTSStudent groups construct a data table and graphs (regular arithmetic scale and semi-log scale) of the data, which can be submitted after class or used as a basis for an at home writing assignment. Students should also answer questions given by the instructor on notecards or via an automated response system. SETTINGThis exercise can be used in any lecture classroom, large or small, or in a laboratory. All required items can be picked up at a local grocery or craft store. COURSE CONTEXTThis module is malleable to both subject and class size. For example, it has been incorporated into senior level ecology lectures (25-50 students), senior ecology laboratories (12 students), freshmen non-majors biology lectures (>200 students), and biology labs at the community college level (24 – 30 students). This module was also modified to improve student understanding of the exponential decay of radioactive elements as applied to age dating in a geology lecture for non-geology majors. Students should work in groups of 3-4, regardless of class size. The module can and should be tailored to the course. Introductory students can get valuable information on graphing and making predictions from collecting and graphing the data. In senior level ecology lectures and laboratories, students can also plot the data on semi-log paper, use the y intercept as an estimate for the original population size, and use the slope of the line to estimate the instantaneous growth rate (r). Calculating the slope and intercept can either be done on the graph paper or using standard statistical packages (MS Excel or R [R Core Team, 2013] depending on class needs and the background of the students). INSTITUTIONThe exercise has been applied successfully at institutions serving very different student populations: Louisiana State University (LSU); Rice University (Rice); and, Baton Rouge Community College (BRCC). Both LSU and Rice are 4-year research institutions, but LSU is public and Rice is private. BRCC is a 2-year institution in an urban setting (Carnegie Foundation for the Advancement of Teaching). TRANSFERABILITYThis module can be used at any institution of higher learning. All the materials required are inexpensive and can be found at a local grocery or craft store. Additionally, this exercise can be adapted for different levels of students. For students with weaker math backgrounds, the graphs allow them to define r visually. Students with stronger math backgrounds can further examine exponential and logistic growth by using the equations. Finally, topics can be extended, depending on the depth of the course, to introduce additional concepts such as the effects of environmental stochasticity on populations growing in a density-independent (i.e., exponential) or density-dependent (i.e., logistic) manner. DOWNLOADSACKNOWLEDGMENTSWe would like to thank the Howard Hughes Medical Institute, and the National Academies Summer Institutes (Gulf Coast) for providing us with an environment to develop this activity. In particular, we would like to the thank Chris Gregg, Joe Siebenaller, and Bill Wischusen for their help and guidance throughout the development of this exercise. Louisiana State University College of Science, Baton Rouge Community College, and Rice University Weiss School of Natural Sciences provided us with the opportunity to attend the Summer Institutes and to test the module in our classrooms. We would also like to thank Molly Keller for helping to sort the candy. CITATIONBarry Aronhime, Bret D. Elderd, Carol Wicks, Margaret McMichael, and Elizabeth Eich. 10 November 2013, posting date. Teaching Exponential and Logistic Growth in a Variety of Classroom and Laboratory Settings. Teaching Issues and Experiments in Ecology, Vol. 9: Experiment #4 [online]. http://tiee.esa.org/vol/v9/experiments/aronhime/abstract.html |
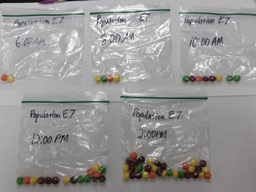
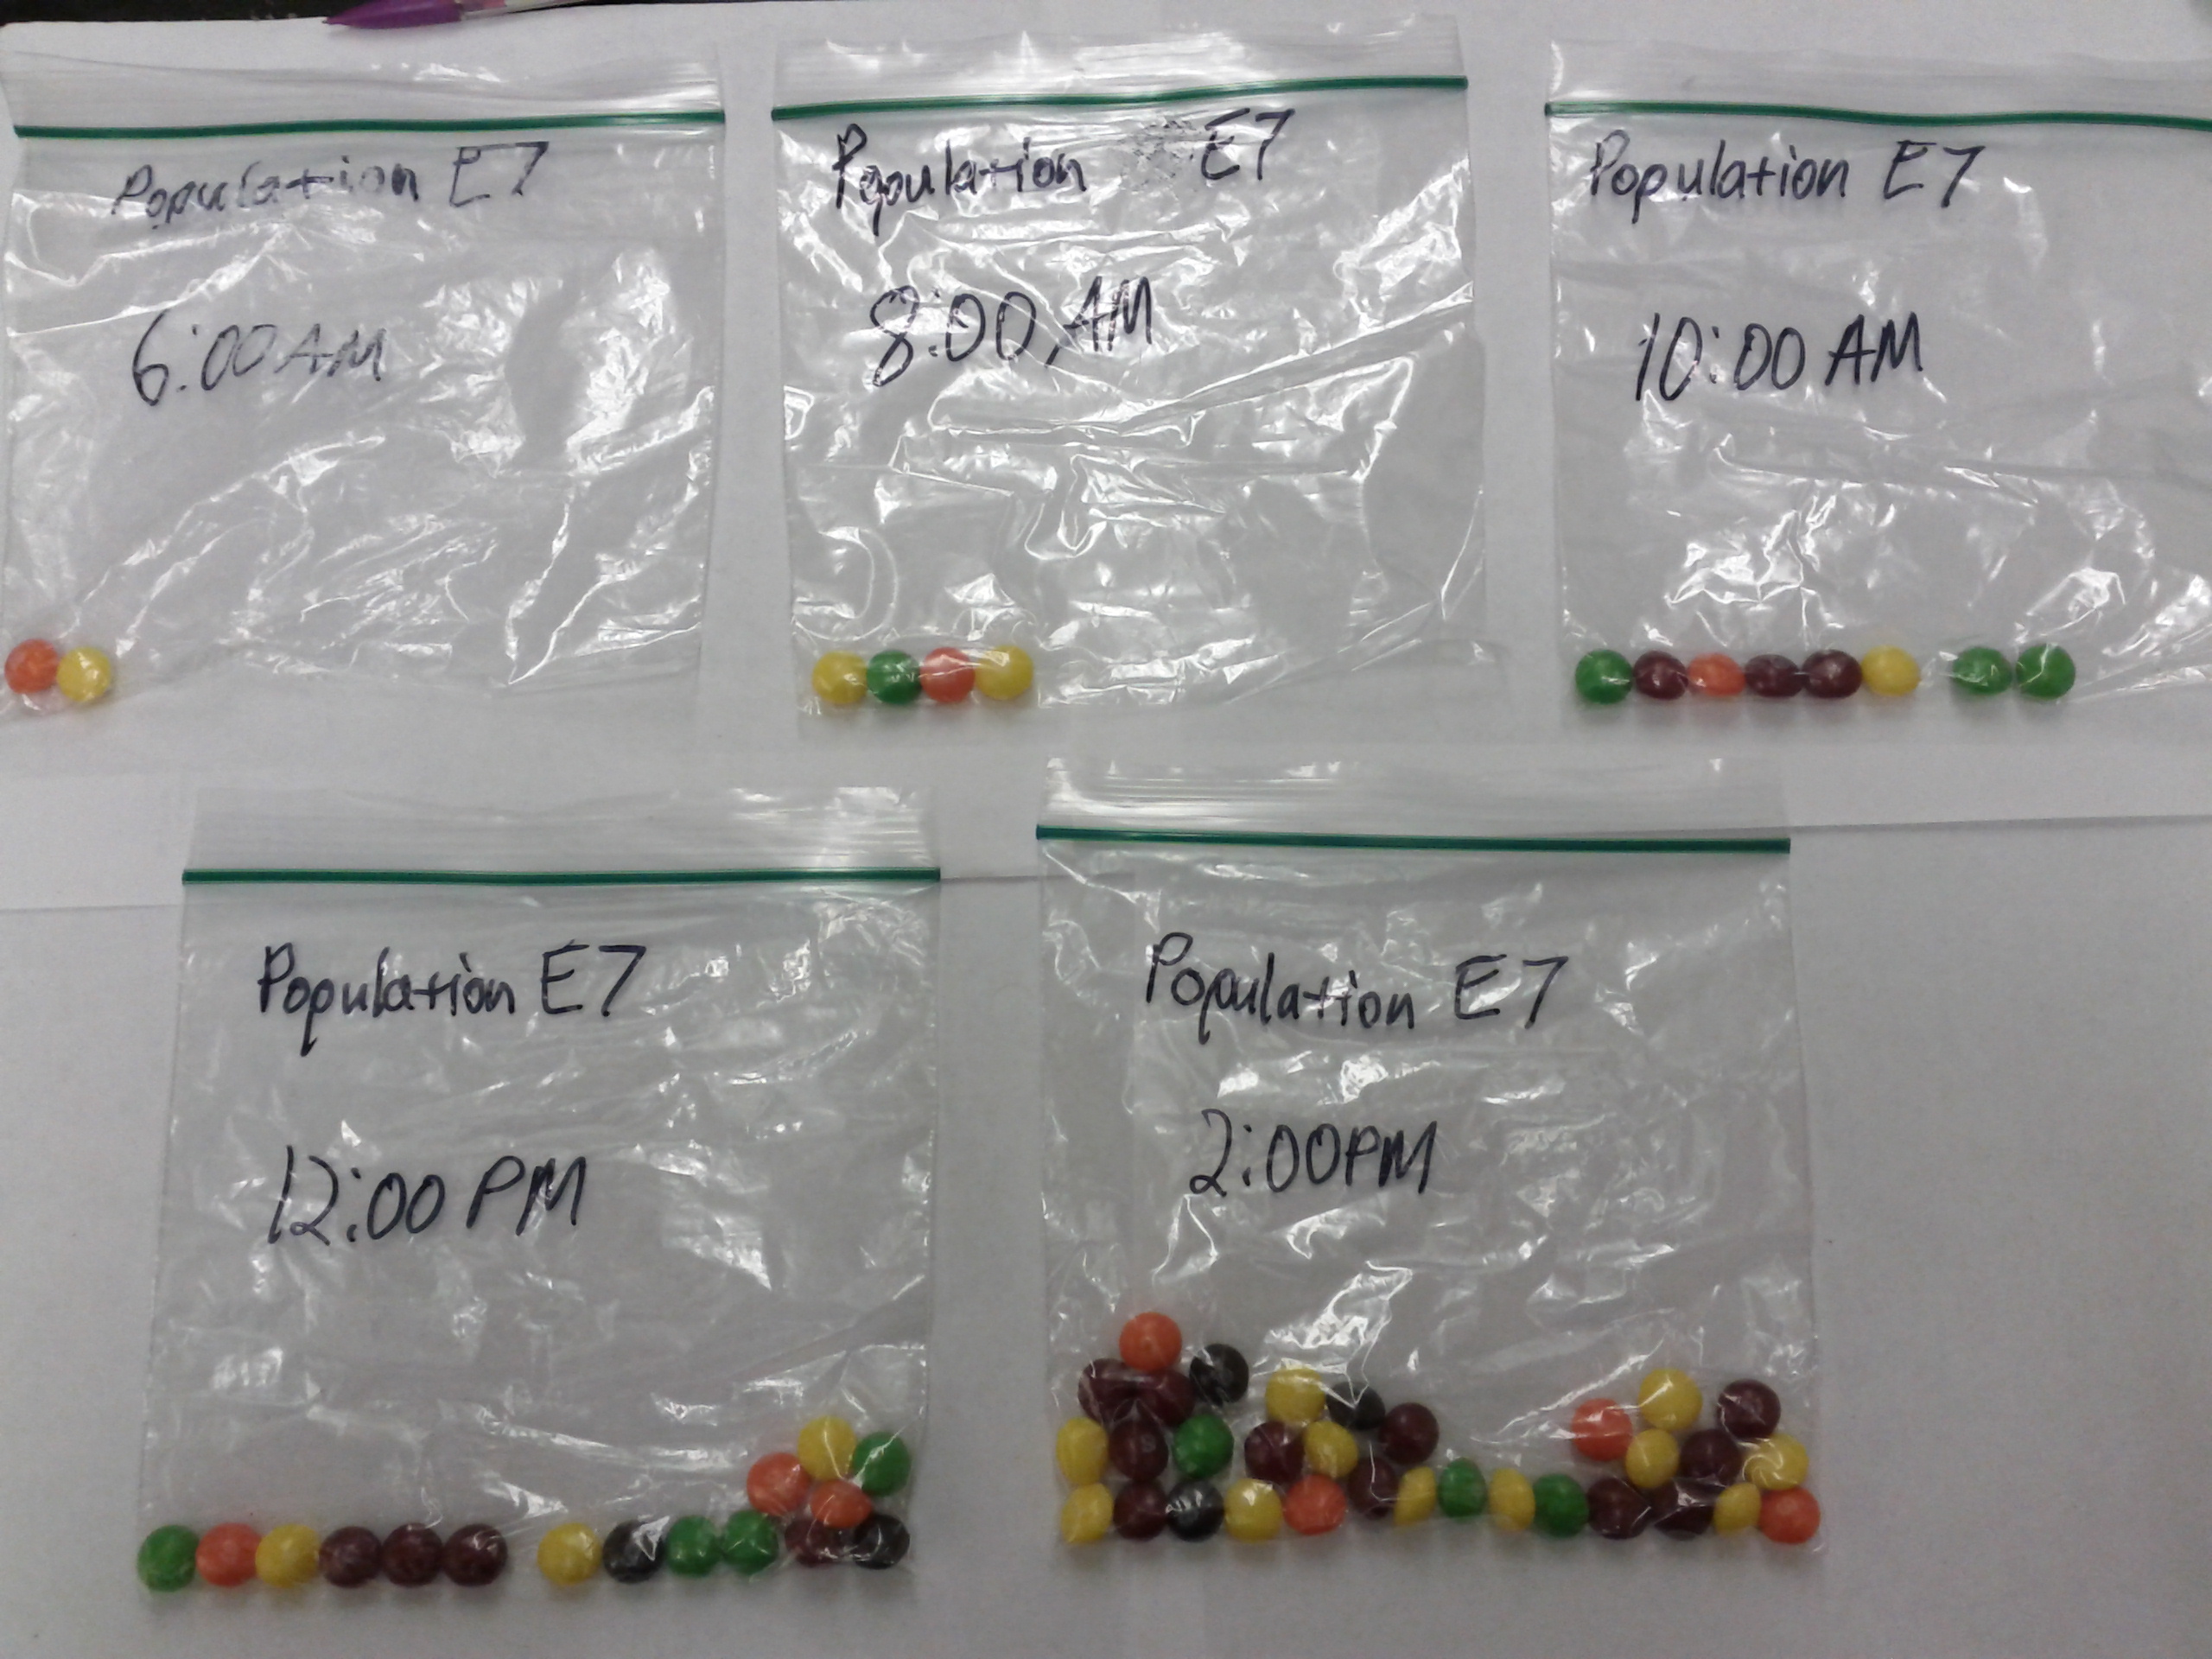
A candy population growing exponentially over a ten hour time period. full size image |
<top> | |